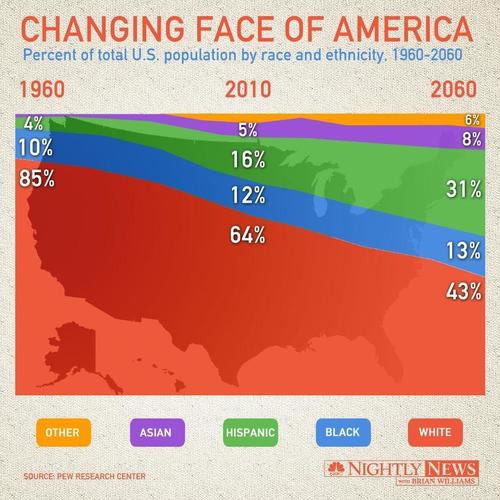
The country is slowly becoming more like a “rainbow,” according to a new book by Paul Taylor and Pew Research called “The Next America”.
Defining Mixed
These groups have many people of mixed heritage:
Latino, Black, Asian, Native American, and White
Latino
(Hispanic) people are mixed by definition. Hispanic has not been defined as a race, but this seems to be changing. Latin American countries have not had anti-miscegenation laws like the U.S. Most Latinos are part Amerindian mixed with some part(s) Spanish, Portuguese or Black.
Black
Black people have been mixing with others since before the founding of the U.S., sometimes by choice and sometimes by force (enslavement rape). One in eight Black people in the Antebellum South were categorized as mulatto.
- Mulattoes in the Postbellum South and Beyond: The Invisible Legacy of an Afro-European People, Custom, and Class in America’s Binary and Three-Tier Societies by Carlton Dubois McClain
- Video Interview of Carlton McClain about his book
Asian
people have been mixing with others in the U.S. since anti-miscegenation laws have been abolished, and also before anti-miscegenation laws were in place. After WWII there were more interracial Asian children in the U.S. due to both “war brides”, and a fear that being Asian and looking Asian can lead to discrimination and even internment.
- War Brides of Japan: Behind the Scenes Trailer
- Fall Seven Times, Get Up Eight: The Japanese War Brides (Trailer)
- War Baby/Love Child: Mixed Race Asian American Art


Native American
Native American people are often of mixed heritage. The U.S. government made it their policy to assimilate Native American’s into U.S. cities.
- Almost half of Native Americans are Mixed Race –Nadra Kareem Nittle
- “Native American people is the only race in America that has to prove that they’re Indian.” – Dwanna L. Robertson
White
White people are often mixed with ‘5 shades of White’, or they are White Latino, or they are ‘One drop’ of color / ‘passing as White’, aka 1/16th or 1/32th of color. White is not counted as White when mixed with people of color, which accounts for the decline in White numbers over time. The other reason the numbers for White drop is because Europeans no longer immigrate to the U.S. at any where near the same rate of other groups. European countries tend to provide good universal health care and tend to have lower gun violence. Police do not routinely carry guns on their person in Britain, Ireland, Iceland, Norway, New Zealand and India. In Norway officers carry arms in their cars but not on their person.
Other
Other people includes Native American (1%) and self identified Mixed people (5%).
Marrying Out
Intermarriage among people of different races is increasingly common. In 1980, just 7% of all marriages in the U.S. were between spouses of a different race or ethnicity. In 2010, that share has doubled to 15% of all new marriages in the U.S. Hispanics (26%) and Asians (28%) were most likely to “marry out,” compared with 9% of whites and 17% of blacks. – Pew Research
If two people of mixed heritage marry, does Pew Research count that as marrying out / intermarriage?
(im)migration Policy
There is no Mixed American Life without pluralism. There is no pluralism without (im)migration.
DiversityInc Keynote: Steve Phillips, Author, Brown is the New White
The 1964 Civil Rights act, pushed by the civil rights movement and Dr. Martin Luther King, influenced a change to U.S. immigration policy so that quotas are no longer based on race. This explains why the graph above shows population diversity quickly expand after 1964.
Title II of the 1964 Civil Rights act outlawed discrimination based on race, color, religion or national origin.
The Immigration and Nationality Act of 1965 abolished the National Origins Formula that had been in place in the United States since 1921.
The Nation Origins Formula restricted immigration on the basis of existing proportions of U.S. population, severely restricting immigration of people who were not already represented in the current U.S. ethnic groups of the time.
Current U.S. immigration law favors the highly educated. U.S. immigration laws are now based on class instead of race. A problem with this is that class is often linked with race, and even more so now because U.S. immigration laws favor certain class groups, then those class groups become associated with certain professions, whether it be highly educated doctors and IT workers, or less educated agricultural workers and service industry workers.
The Immigration Act of 1924 included an Asian Exclusion Act and Nation Origins Act which outright banned the immigration of Arabs and Asians.
The Chinese Exclusion Act of 1882 was repealed in 1943. Years later, U.S. culture finally considers Chinese food to be American food. You can tell because most every significant city in the U.S. has a Chinese restaurant. Chinese food is so popular with Americans as to now be considered American food, the way that Mexican and Italian food is also American food because you see these restaurants in so many cities.
Muslim ban, Refugee ban, Green-card holder ban 2017
List of United States immigration legislation starting from 1790.
- There are 35 categories of migrant visas
- For refugees: Victim of Criminal Activity
- There are 17 categories of immigrant visas
- Immediate Relative & Family Sponsored (6)
- Employer Sponsored – Employment (11)
Genocide and Population Control
- Amerindians used to make up 100% of the Americas. Native Americans make up only about 2 percent of the U.S. population in 2014 and are projected to make up only 2.4 percent of of total U.S. population in 2060. –census.gov
- Black percentage of U.S. population is expected to grow by only 1% in 50 years according to Pew Research graphic above. And shrink by half a percent according to demographer Dr. Priyank Shah. Mass-incarceration and the war on drugs (war on people) is removing Black people during the prime of their life, the time when most people are starting families. And U.S. police are killing Black people at the rate of 1 every 26 hours in 2015, and U.S. police and vigilantes killed a Black person at the rate of 1 every 28 hours in 2012. Not to mention historic lynchings.
- Asians were murdered by White people during the gold rush and also excluded from entering the U.S. between 1882 and 1965.
- Latinos were lynched by White people during the gold rush, and in the South West between 1846 to 1925. Latino communities are also targeted by the war on drugs (war on people), and in-turn also targeted by mass-incarceration.
- Murdered by police Amerindian, Black, and Latino people are murdered by police disproportionately more than other groups

Reblogged this on Central Oregon Coast NOW.
LikeLike
Reblogged this on Civil Rights Advocacy and commented:
We are all of mixed race and ethnicity. This infographic showing the change of face in the United States along with the description of race and ethnicity does a great, succinct job of explaining this phenomena
LikeLike
What exactly is the skin tone of Africans? I am African and I can tell you that Africans do not have one skin tone. Just that phrase alone shows how your mind has been colonized by white supremacy.
LikeLike
Notice the change in Asian American population after the 1964 civil rights act pushed the nation to not base immigration policy on race. Y’all, the U.S. had an Asian exclusion act.
LikeLike
A person told me about ‘population control’ Look at this graph. Which population is almost not growing?
LikeLike
Nice job! Thanks for posting this! 🙂
LikeLike
Reblogged this on MrMilitantNegro™.
LikeLike
You have an excellent blog. It is very interesting. Hugs, Barbara
LikeLike
Reblogged this on Illuminate.
LikeLike
Hispanics are mostly of mixed race and most Hispanics in the U.S. are from Mexico.
“On average Latinos [in the U.S.] had about 70 percent European ancestry, 14 percent Native American ancestry and 6 percent African ancestry.
Read more at http://blog.23andme.com/23andme-research/dna-usa-2/#r3y1qE4Z8Pkmvi32.99
And almost all African-American’s are of mixed heritage
http://www.mixedracestudies.org/wordpress/?p=28754
LikeLike
And the race is on! LOL
Abagond did a great post showing that in the year 2100 the U.S. will be mostly Black and Latino.
Check it here
LikeLike